FOSS
Admin App for
Spring Boot
Monitor and Manage Spring Boot Applications
in Real-Time with Ostara for Spring
App Demo
Explore the functionality of Ostara through a short demo video. Dashboards, metrics, app properties, beans graphs, loggers, thread profiling, and more.
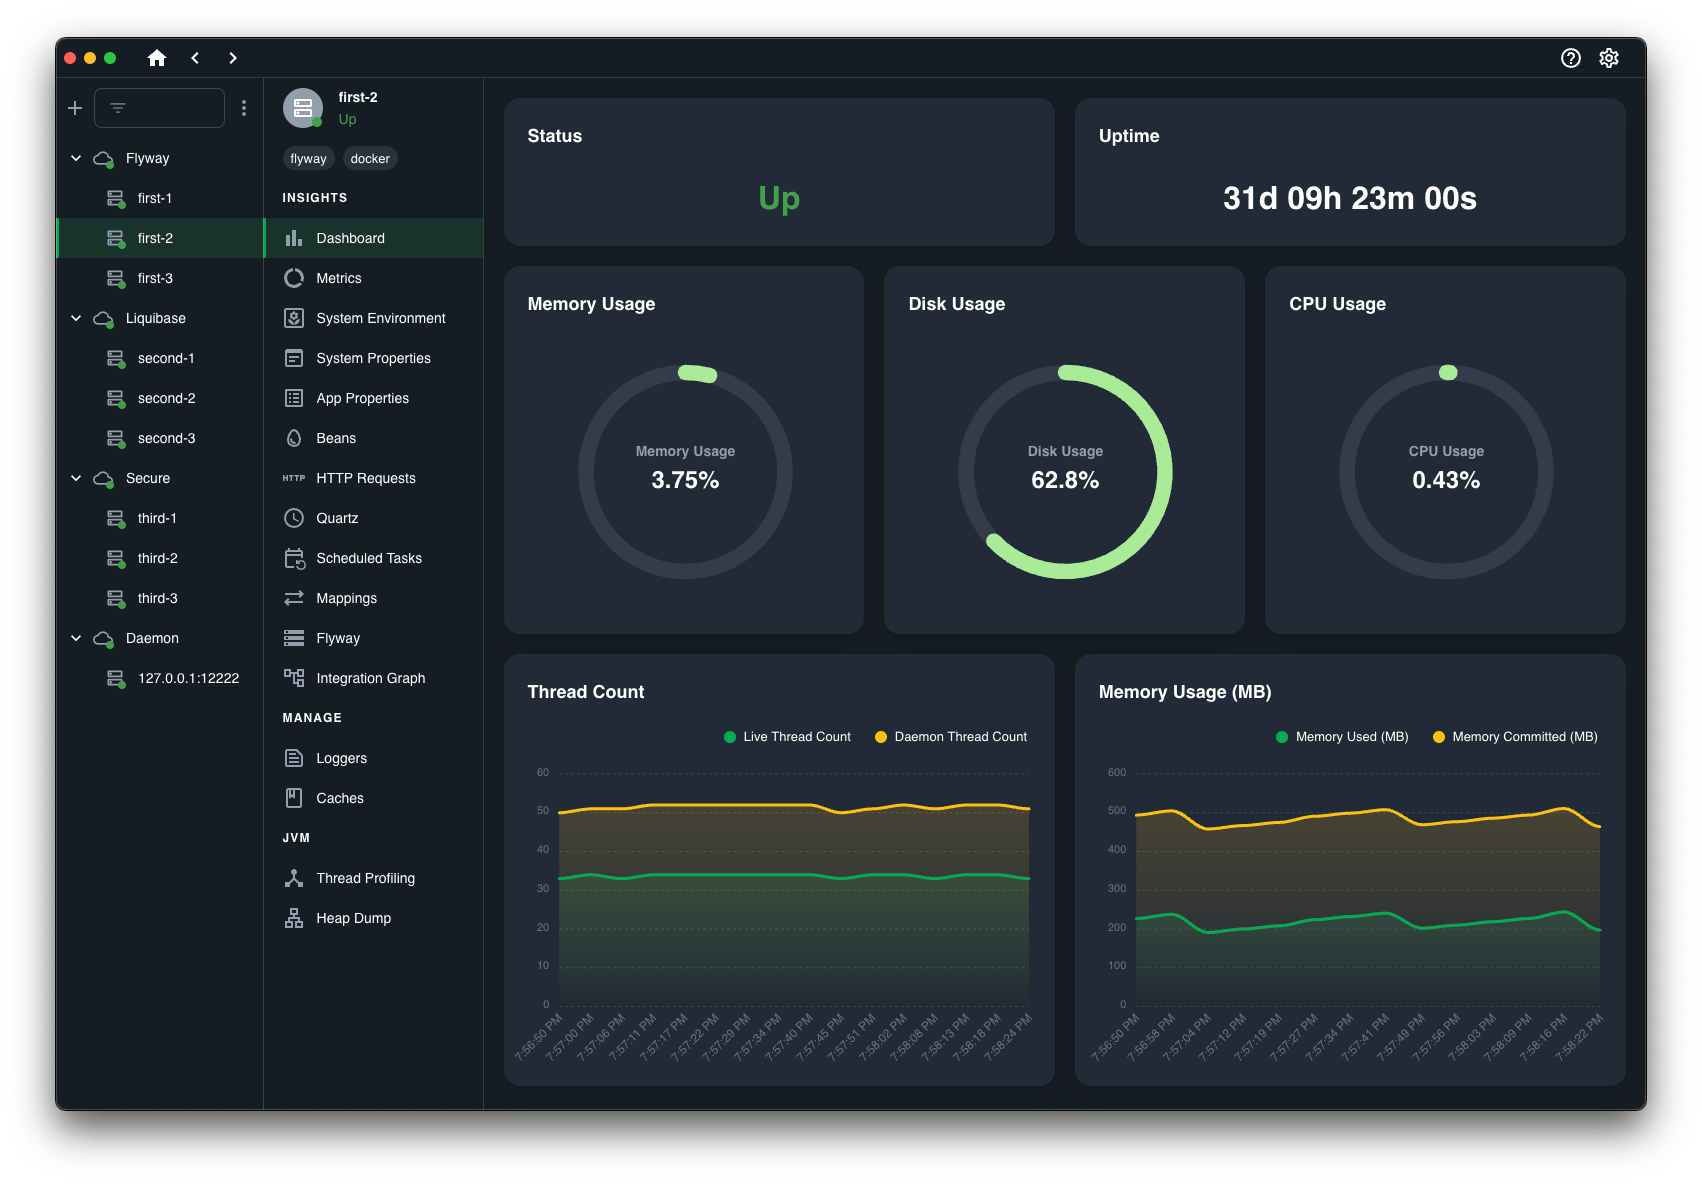
Monitor
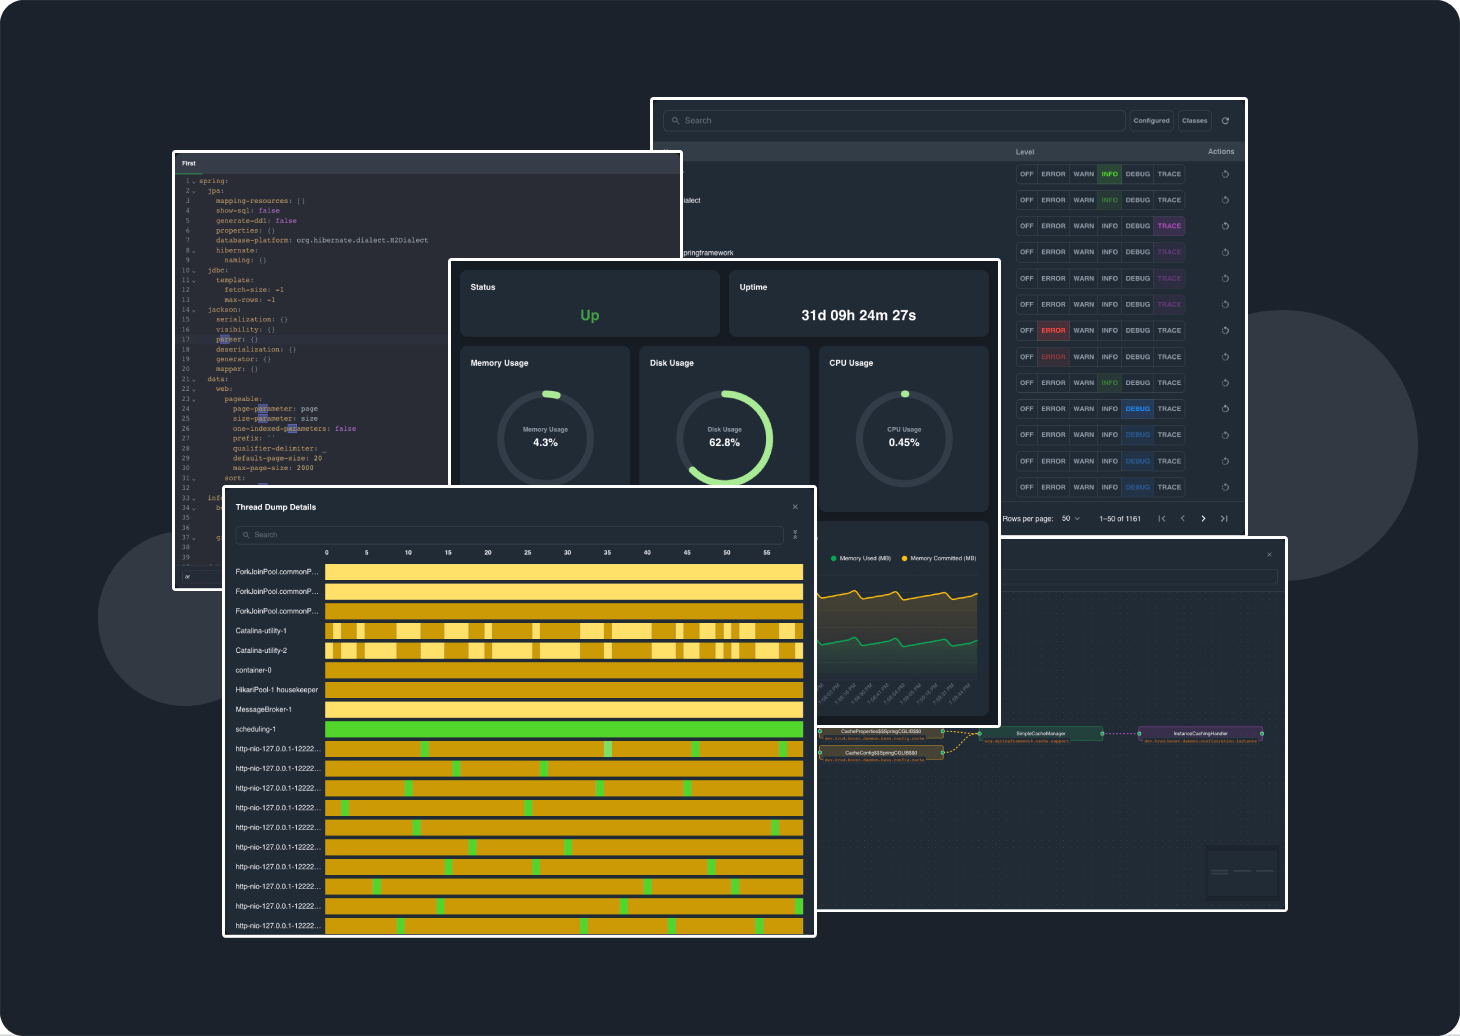
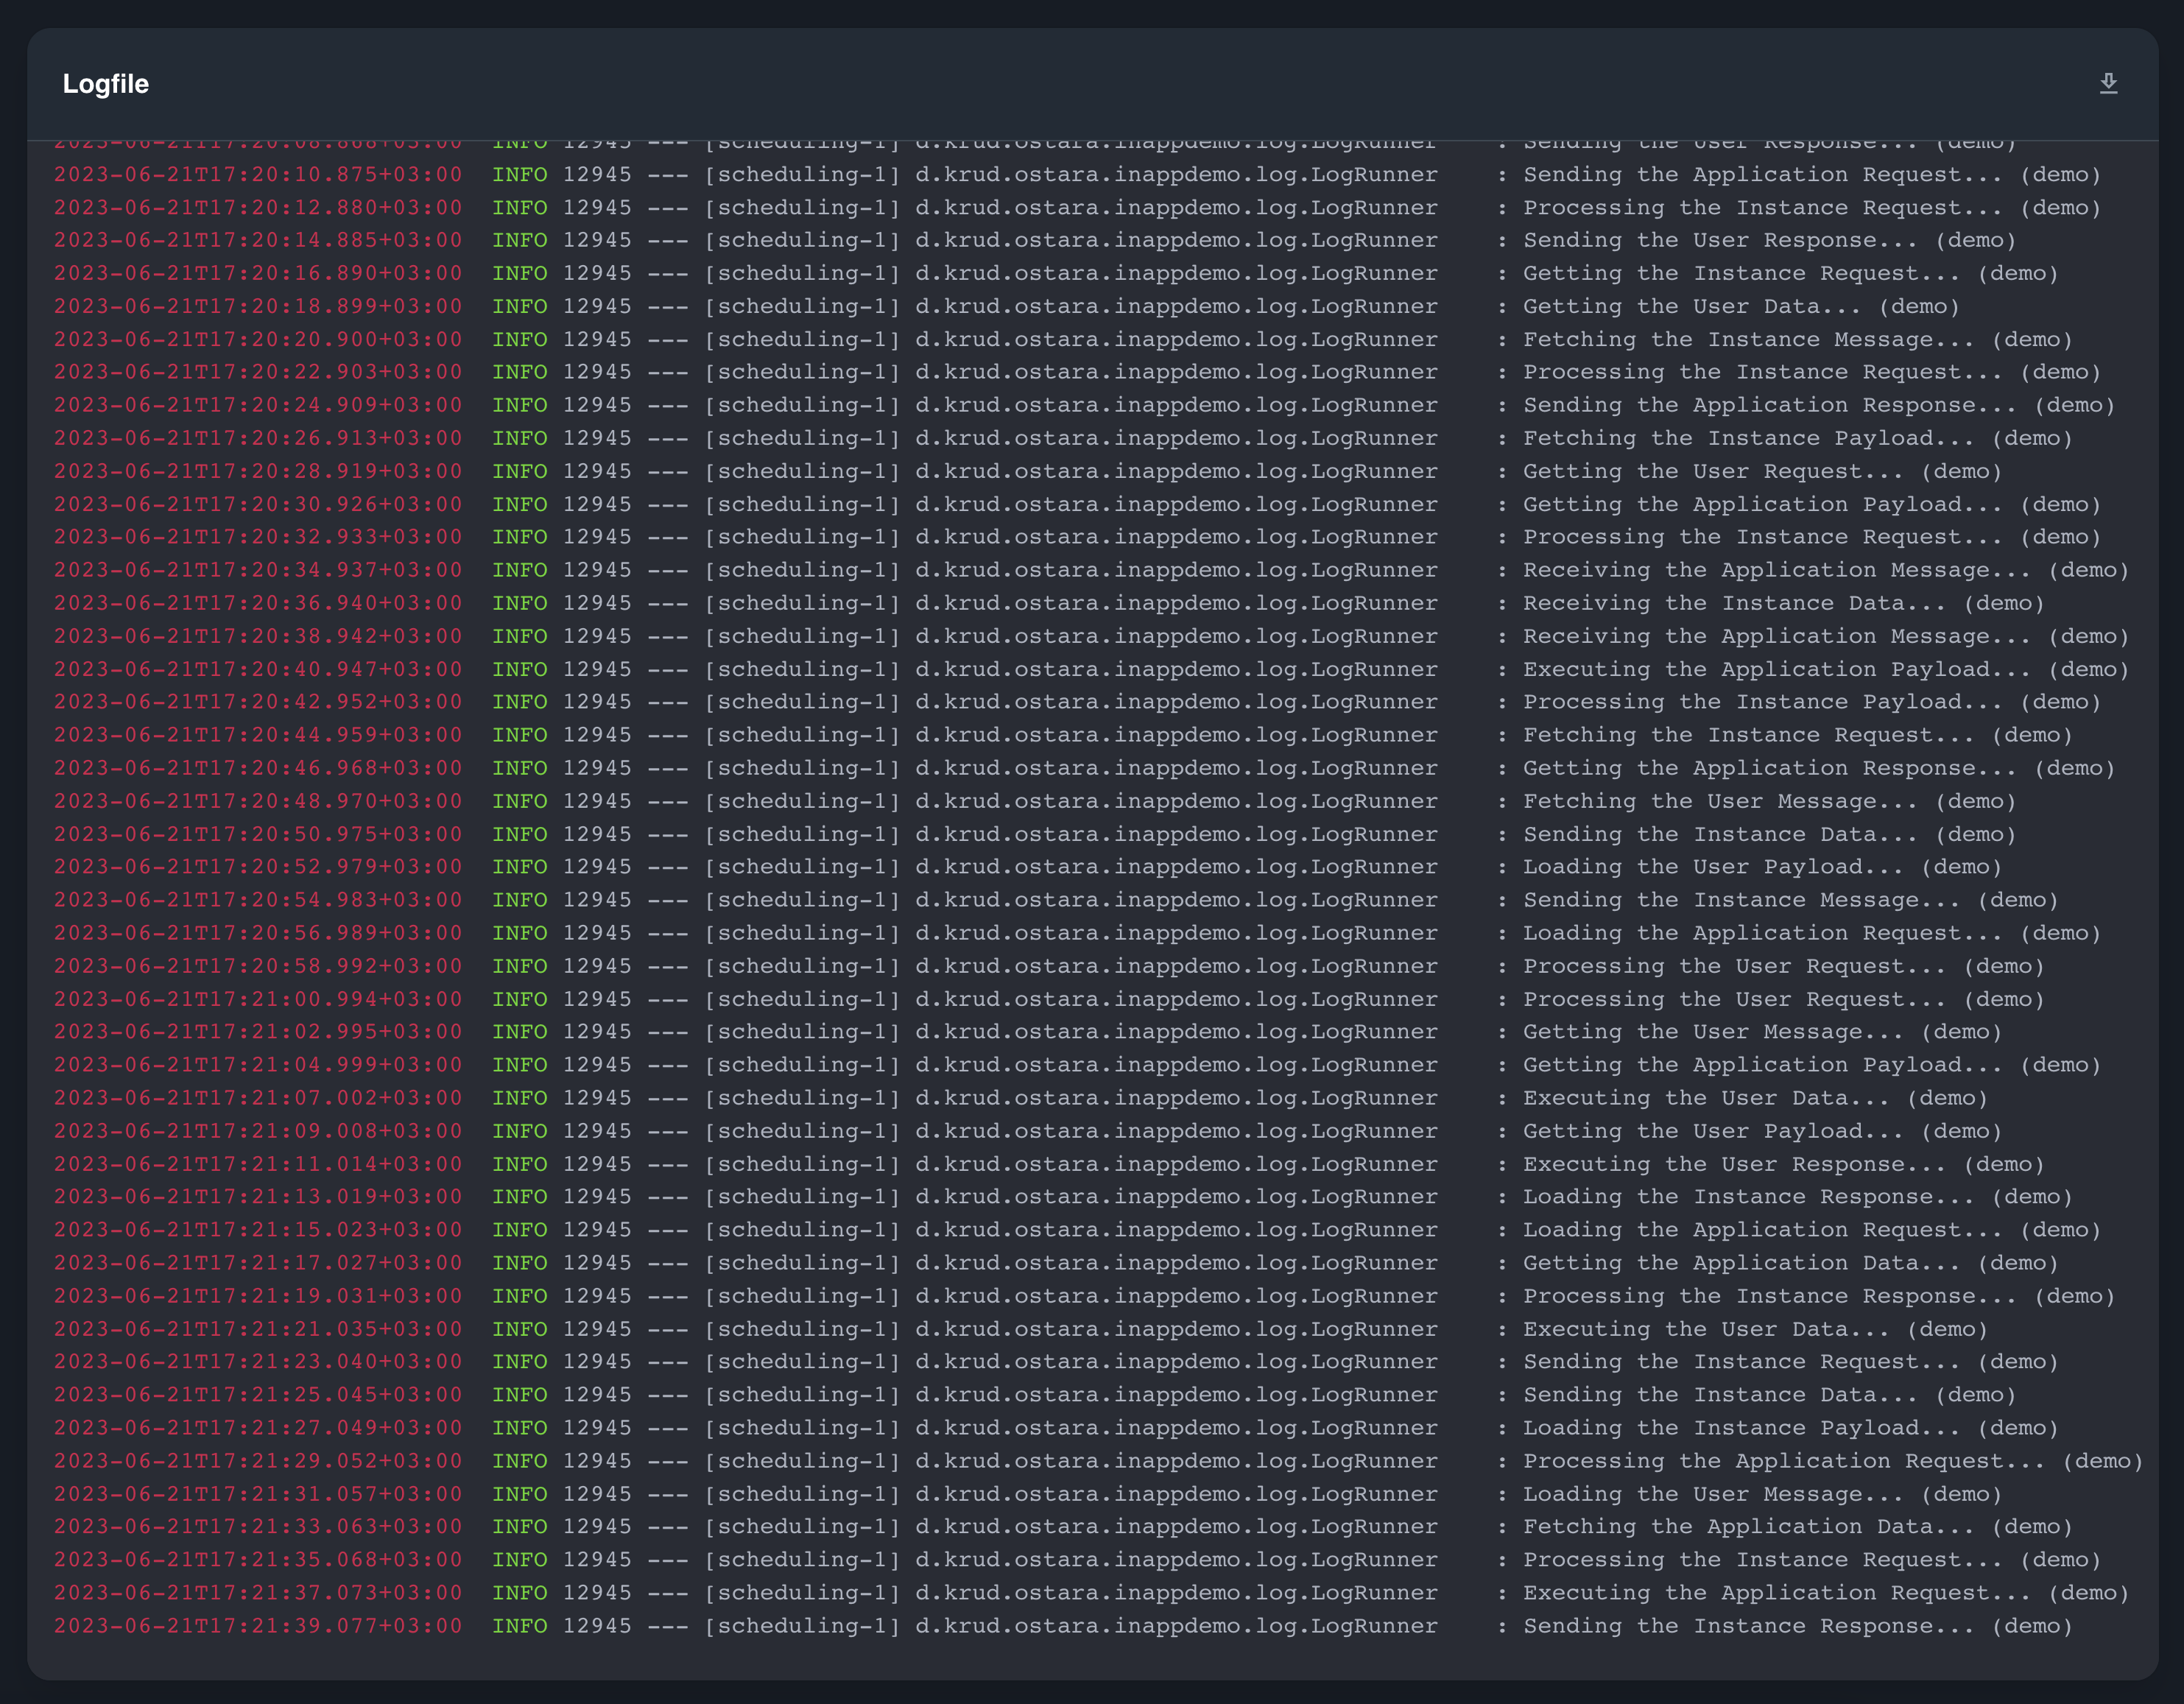
Real-Time status & metrics
Up-to-date information on metrics, health status, thread dumps, log levels and more. Quickly identify and diagnose any issues that arise.
See Docs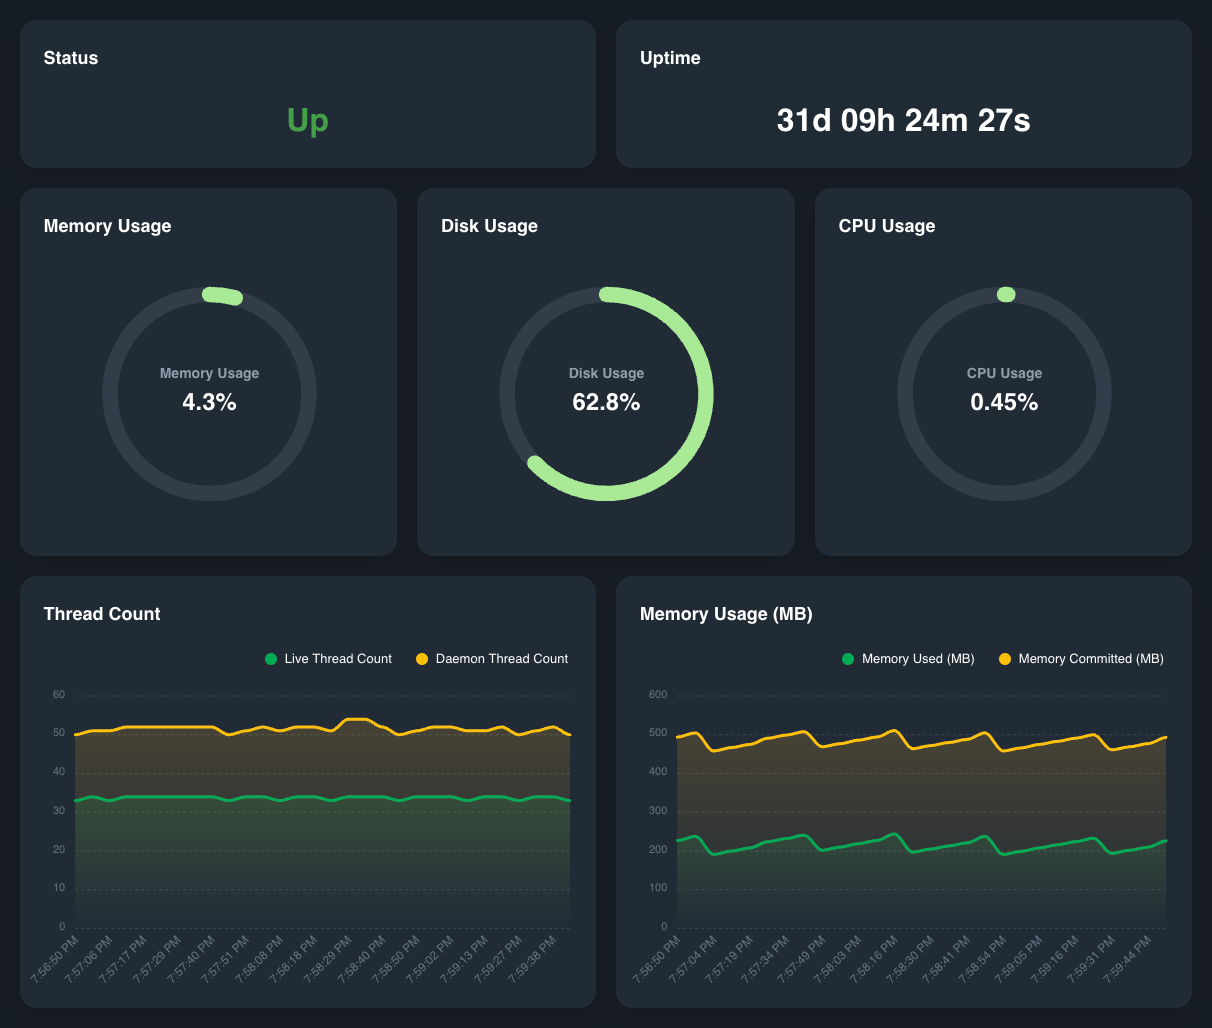
Manage
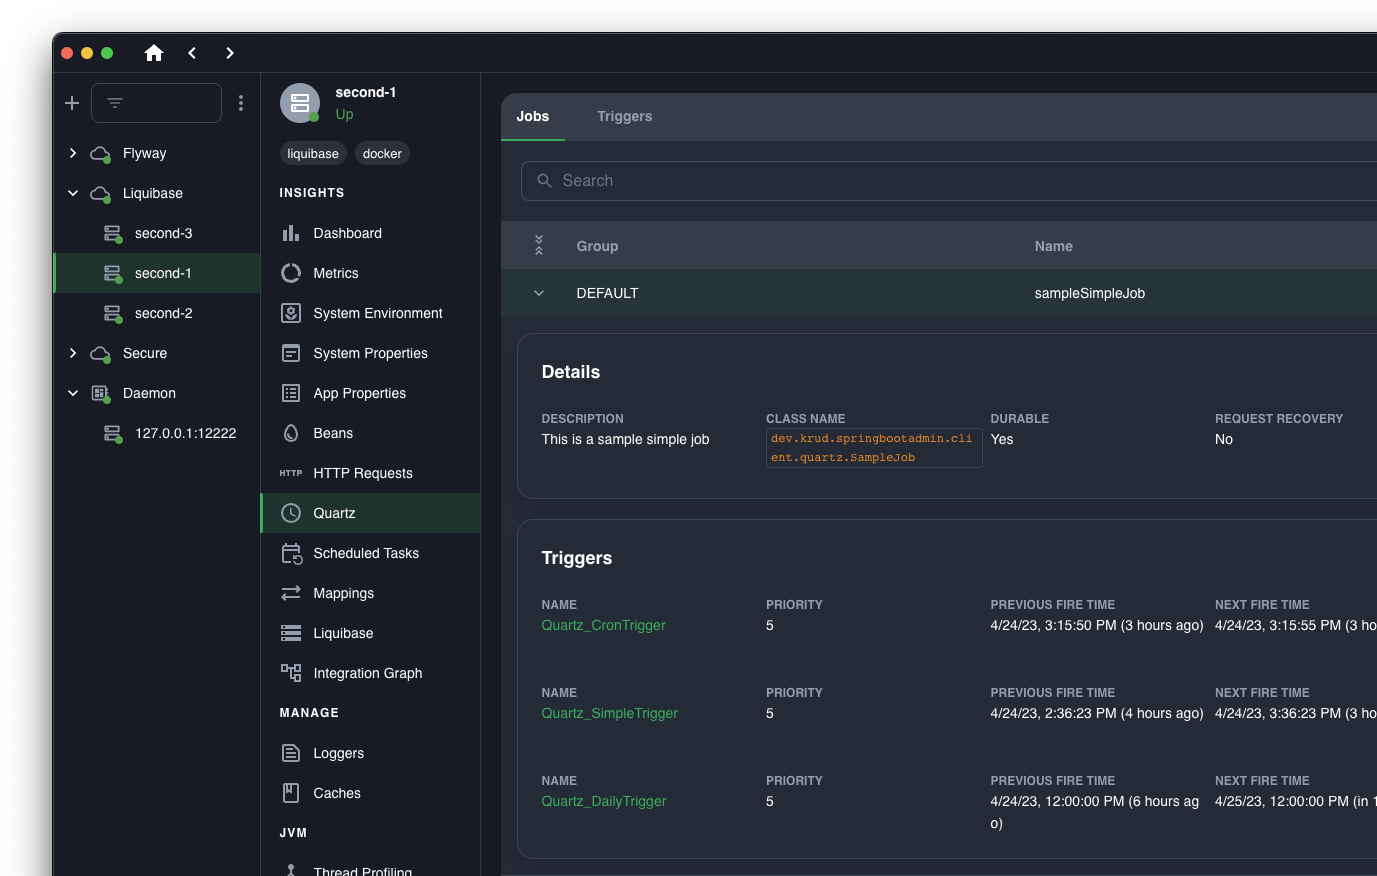
Simple & easy management console
A user-friendly UI for managing log levels, caches, thread dumps, feature toggles and more. No server restarts, no human errors, no problems.
See Docs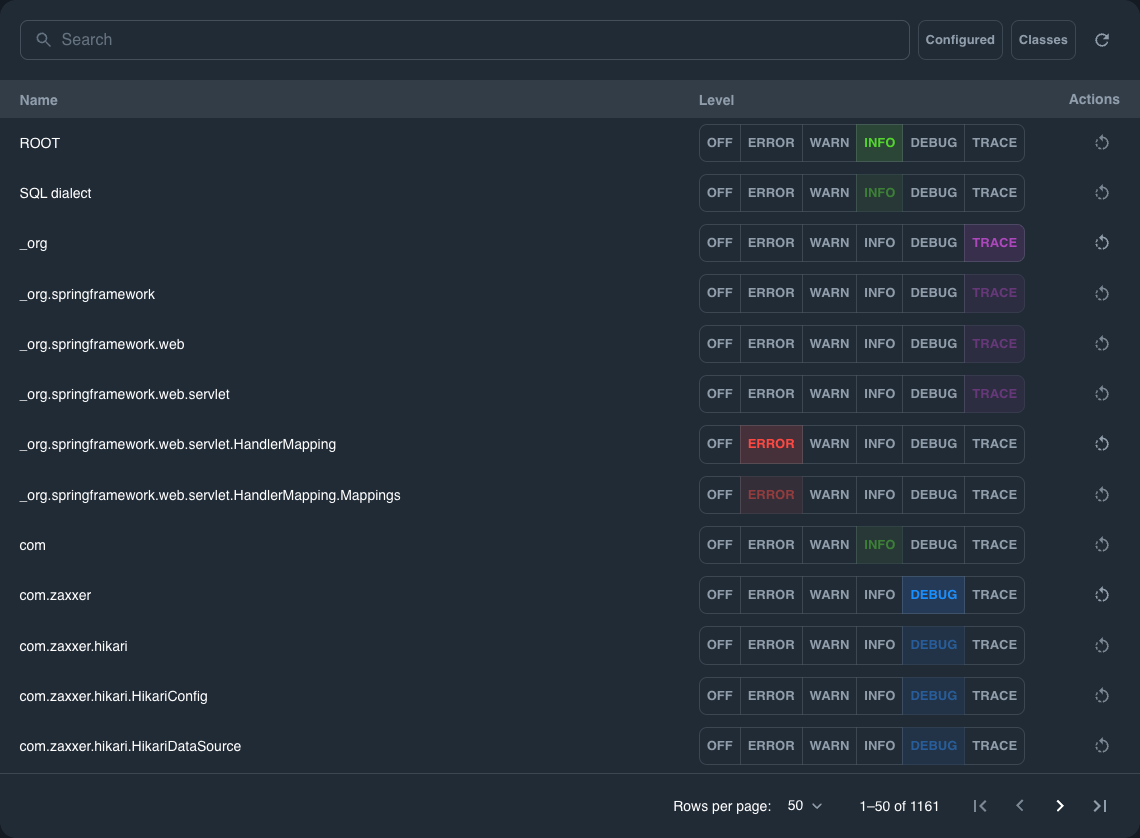
Get started in 3 simple steps
No code required, no dependencies, no work. Get up and running in 2 minutes.
Features
Feature highlights
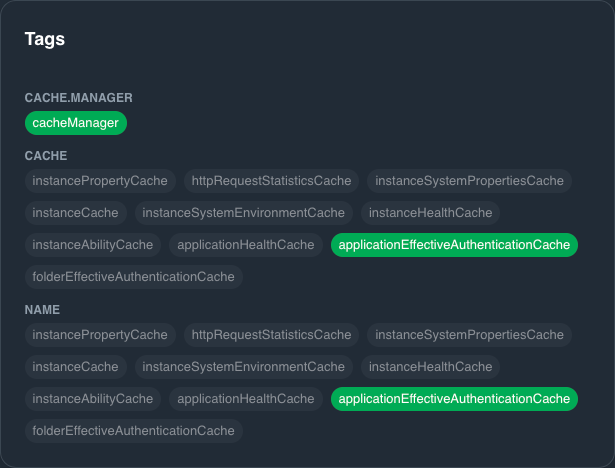
Metrics and tags
navigator
Instead of using Spring Boot Actuator endpoints manually to look at your metrics, you can navigate, filter, and glimpse insights, using Ostara's Spring Boot admin panel.
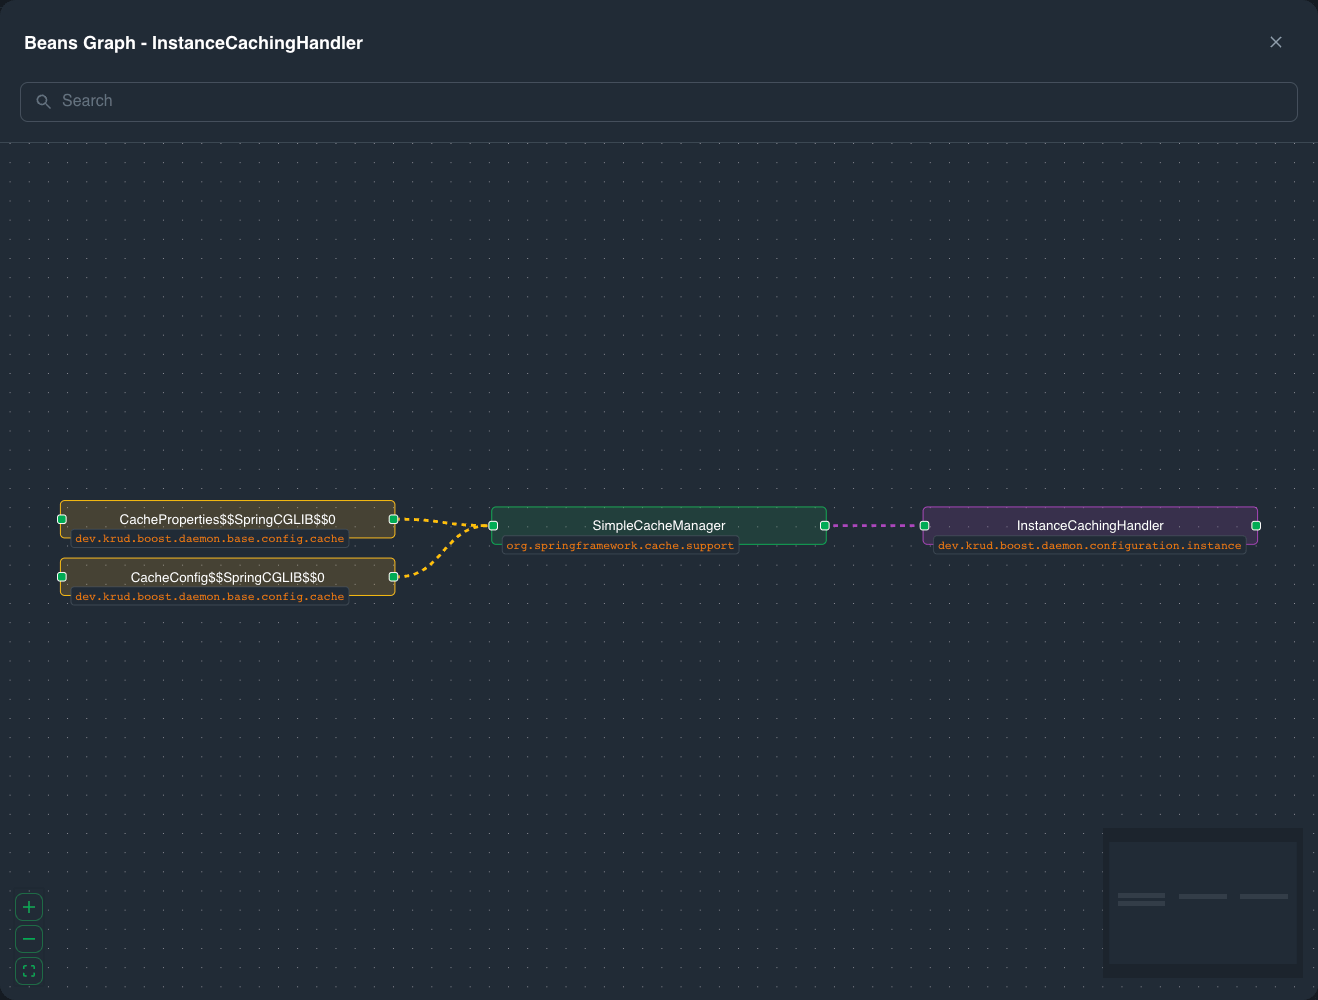
Beans dependency
graph
By cross-referencing data from multiple spring actuator endpoints, we have created a unique dependency graph directly in our spring admin UI.
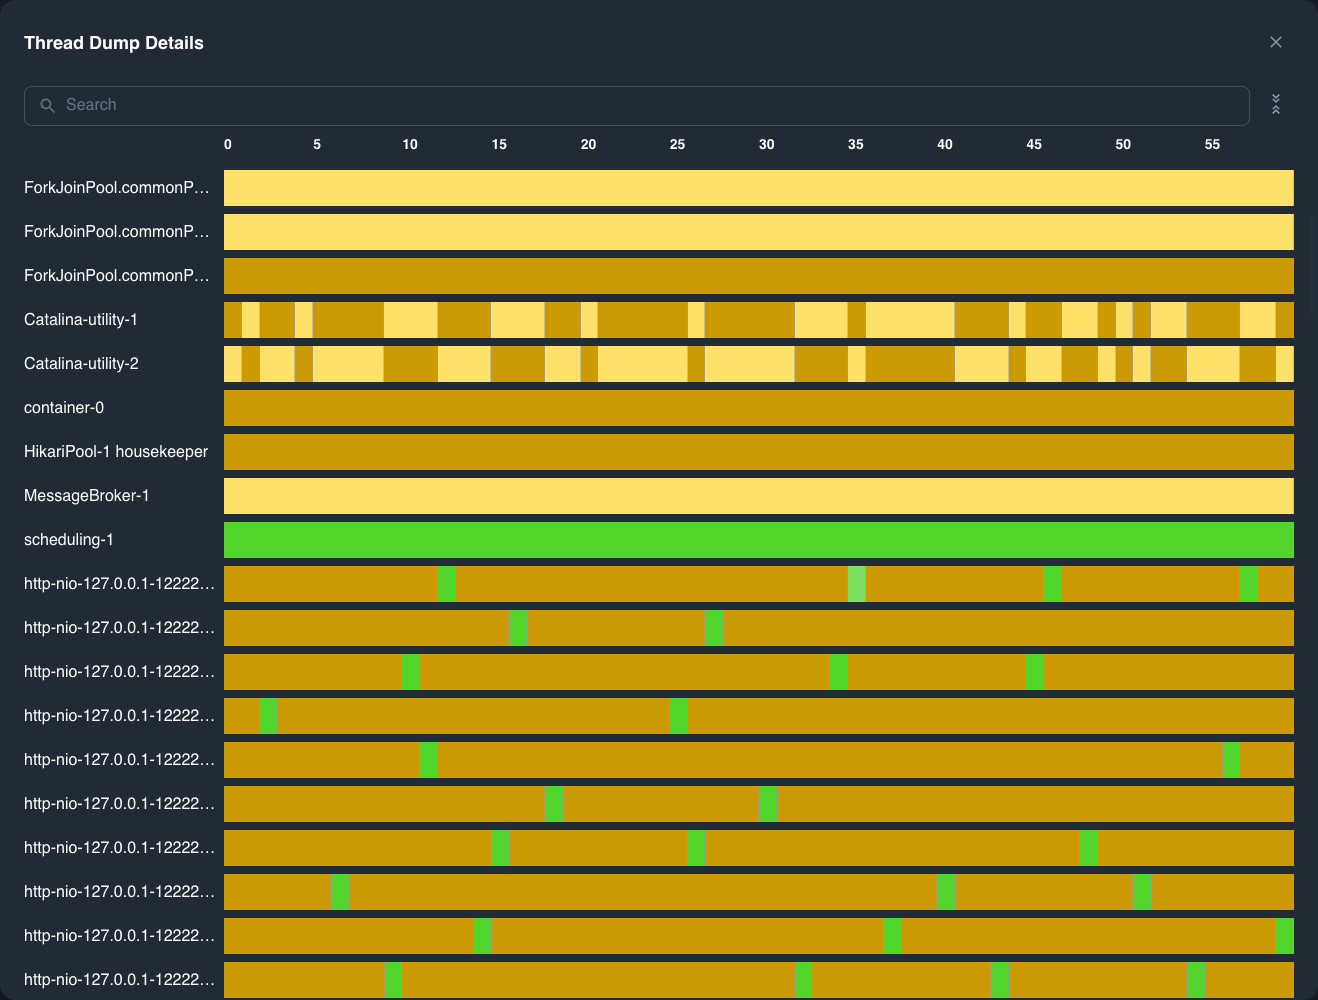
Generate and investigate
thread dumps
Utilizing the thread dump feature within the admin panel empowers you to deep dive into the internal workings of your Spring Boot applications.
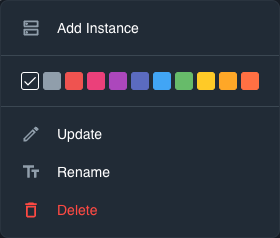
Custom icons and
colors
Customizing the look and feel of our admin UI is simple, choose custom colors and icons that mean something to you.
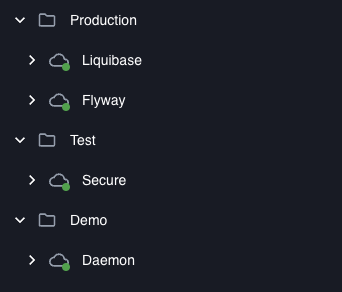
Arrange instances in
applications & folders
Group your Spring applications according to your environment architecture, you can group them however you need.
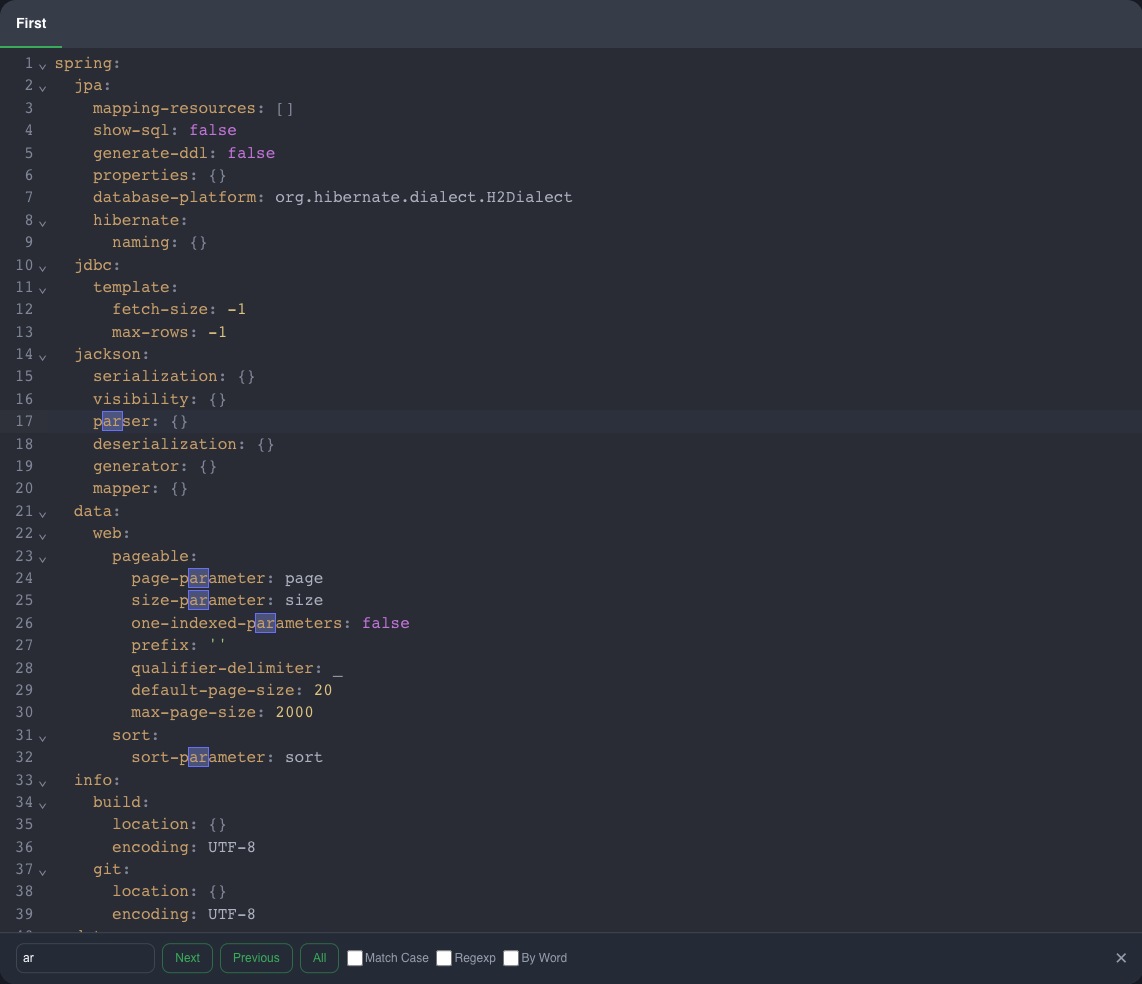
Effective & efficient app
properties view
In the admin panel you can view all the current application properties received directly from Actuator in Spring Boot.
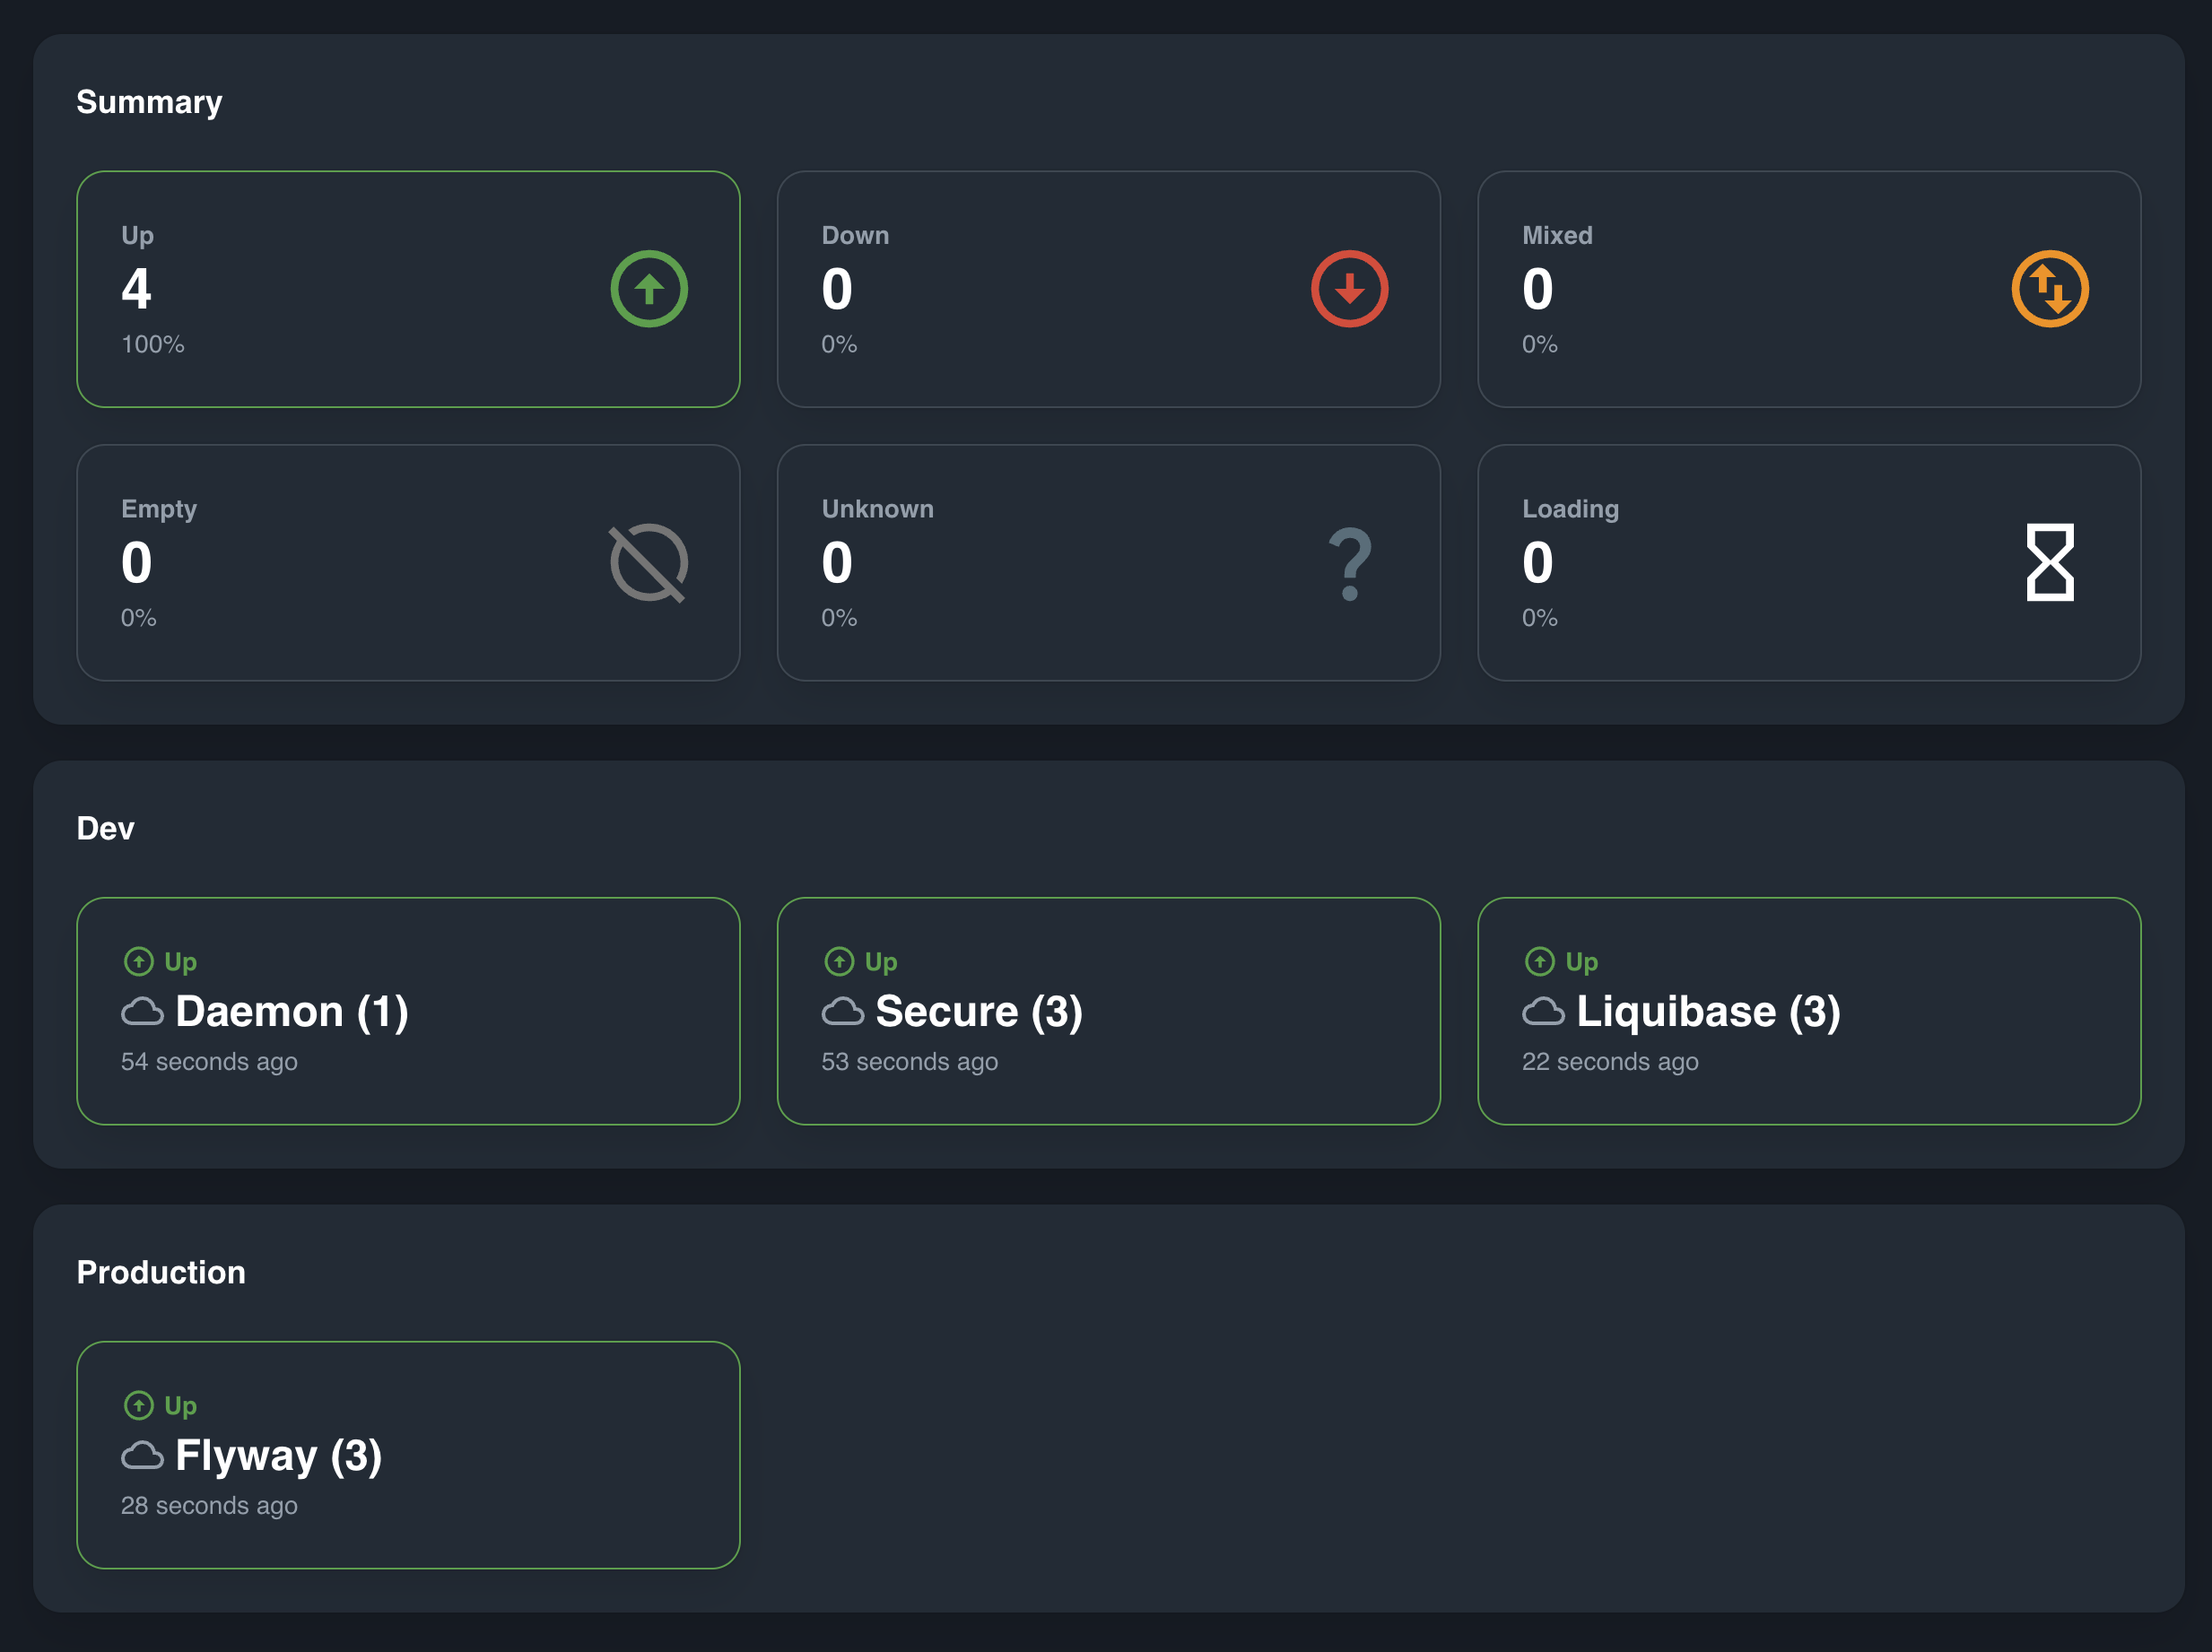
Multi level
dashboards
Stay updated on the real-time status of your services through our diverse range of dashboards. Gain quick insights into your services by utilizing the global, folder, application, or instance dashboards.
Frequently asked questions
Ostara allows you to gain insights into the performance and health of your applications by providing real-time data of metrics such as CPU and memory usage, app and system properties, beans and their dependencies, and much more. In addition, the app allows you to perform actions on your applications like changing log levels and evict caches.
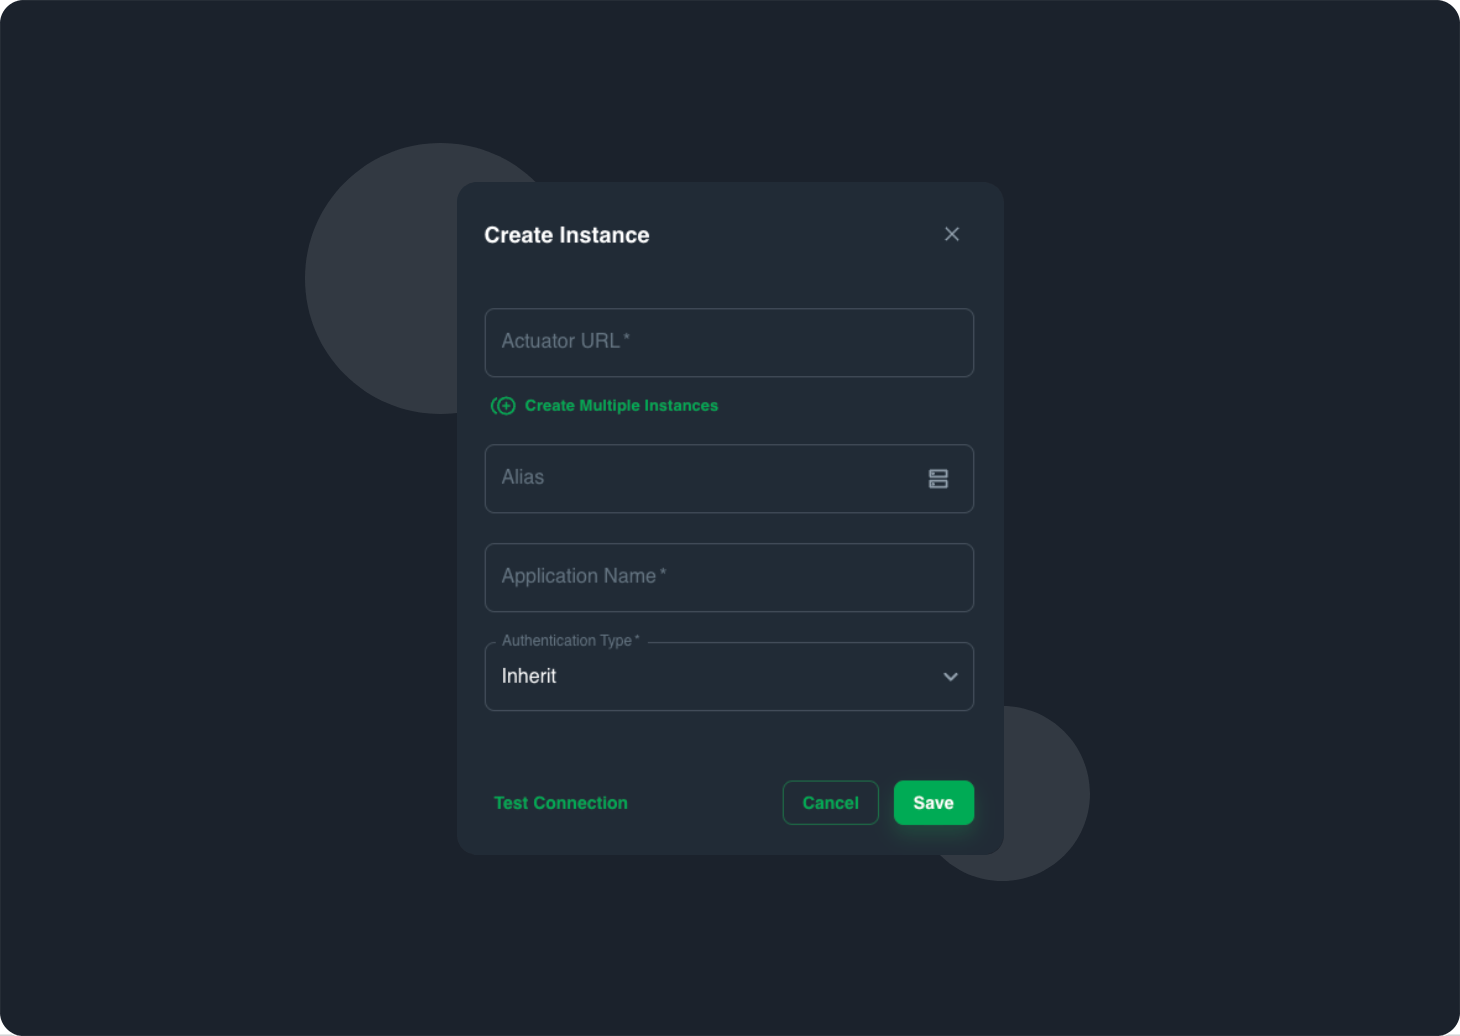
Ostara utilizes all the spring boot actuator endpoints to build a simple and intuitive spring boot admin panel. Without any need for code changes, and completely decoupled from your spring boot applications.
2. Add your Actuator API URL.
3. That's it. Everything is ready to manage and monitor your Spring Boot applications with ease.
More info is available in the Quick Start Guide.
Spring Boot Admin requires you to host a service and modify your code to get an admin panel. On the other hand Ostara only requires you to install an app on your local machine to gain access to a user-friendly admin panel.
1. Starring the project on Github.
2. Submitting issues for bugs you've found or features you would like to see.
3. Becoming a contributor.
Technical questions
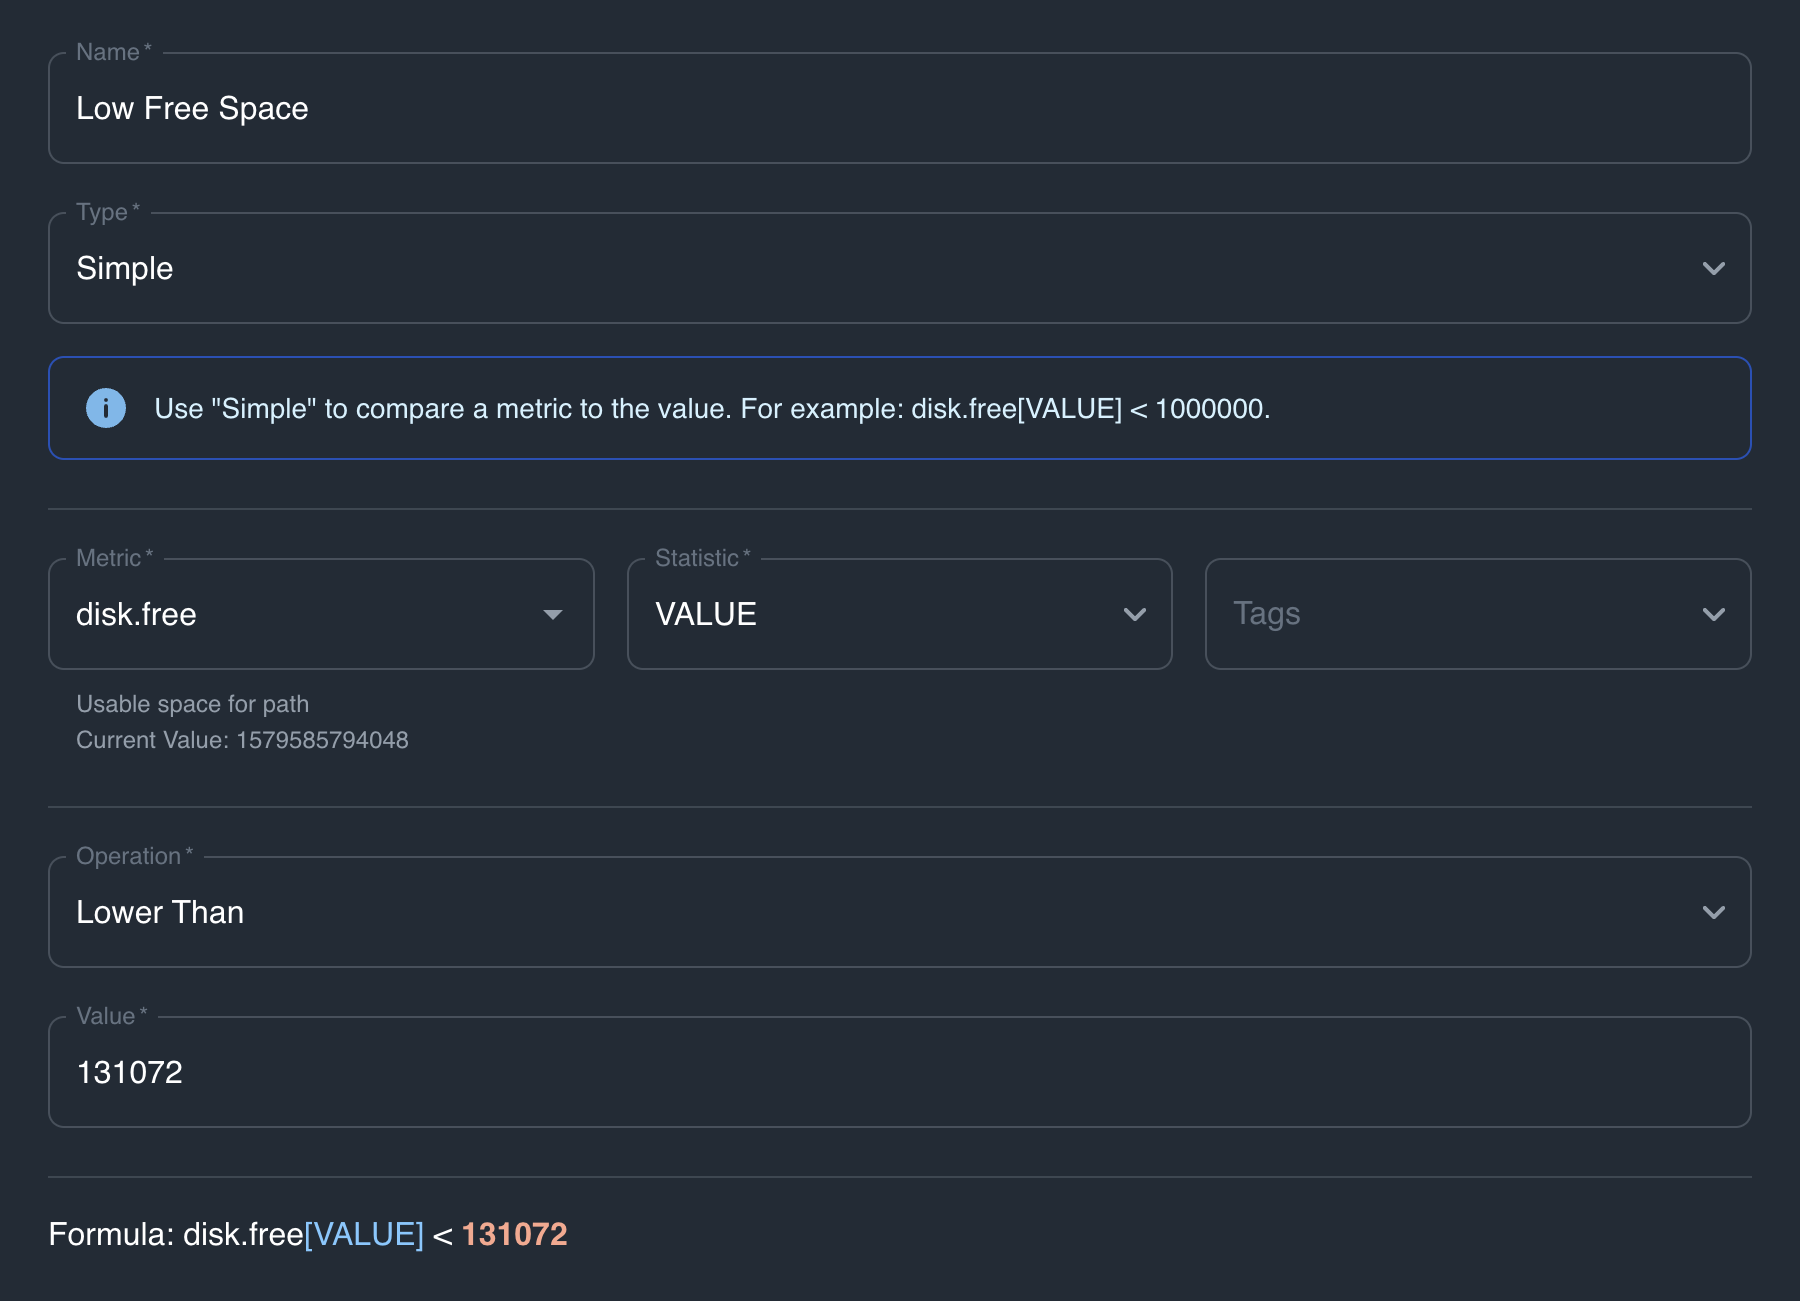
In addition, Ostara empowers you with robust alerting capabilities. It allows you to create customized rules that leverage metrics obtained from your Spring Boot applications. By setting thresholds or conditions, Ostara can proactively detect when a metric surpasses the defined criteria. In response, it promptly triggers alerts and sends OS notifications, ensuring you stay informed about any potential issues or performance anomalies.
However, we understand that there may be cases where you prefer to maintain your modifications privately. In such instances, you have the option to fork the repository and work on your own version of Ostara tailored to your specific needs.
We are also excited to inform you that we are currently working on a plugin system for Ostara. This upcoming feature will enable users to develop plugins and extensions to add custom code and functionality to Ostara without the need to modify the core application. This will provide even more flexibility for customization while keeping your modifications separate from the main Ostara codebase.
If you require any assistance while writing custom code or have any questions, please don't hesitate to reach out. We are more than happy to help you out and provide guidance on integrating your custom code or utilizing the plugin system once it becomes available.